

- What Happened at July Fed Meeting and Why Fed Rates Remain Unchanged
- Why Treasury Yields Rose After the Fed Kept Rates Unchanged
- How Fed Rate Decision Could Affect Nvidia, Microsoft, Meta and Other AI Stocks
- FOMC Rate Outlook: Will the Fed Raise Interest Rates in 2026?
- S&P 500 Outlook After the Fed Rate Decision: Valuation Scenarios
- What US Stock Investors Should Watch After July Fed Meeting
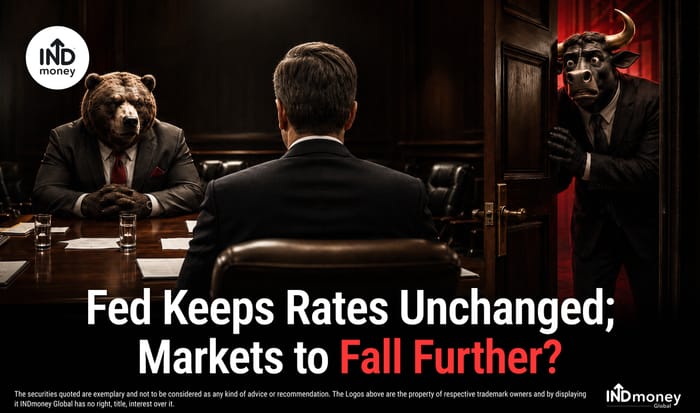
The US Fed kept interest rates unchanged yet again in July. But the most important signal from the Fed meeting was not that interest rates stayed steady because markets largely expected that. The real warning came from somewhere else: the 2-year Treasury yield fell, while the 10-year rose to 4.67% and the 30-year reached 5.20%.
Meanwhile, the S&P 500 fell 1.52%, and the Nasdaq 100 dropped 2.1%, taking the latter 11% below its June record. That combination tells a more useful story than the Fed rate decision alone. Investors became less worried about an immediate hike, but more worried about long-term inflation, policy credibility and the price of funding the AI boom.
Let’s break down what the July FOMC meeting actually changed, why the bond market’s reaction matters more than the unchanged headline rate, and what could decide whether US stocks stabilise or fall further.
What Happened at July Fed Meeting and Why Fed Rates Remain Unchanged
The Federal Reserve kept its target rate at 3.50% to 3.75%, where it has remained since December 2025. The decision passed by a 9 to 3 vote. The three dissenting Fed committee members wanted a 25-basis-point hike.
The official statement offered almost no new economic direction. It again described growth as solid, unemployment as broadly stable and inflation as elevated. That makes the vote, rather than the wording, the main change from June, when the decision was unanimous. The Federal Reserve’s July statement confirms the rate range and the three dissenters.
| Data available to the Fed | Reading before Fed meeting | What it signalled |
| June headline CPI | Down 0.4% MoM; up 3.5% YoY | A sharp monthly cooling, helped by lower energy prices |
| June core CPI | Up 2.6% YoY | Underlying inflation improved, but remained above 2% |
| May headline PCE | Up 4.1% YoY | The Fed’s preferred inflation measure was still too high |
| May core PCE | Up 3.4% YoY | No basis to declare inflation defeated |
| June payroll growth | 57,000 | Hiring slowed, reducing the urgency to tighten immediately |
| June unemployment | 4.2% | Labour conditions remained stable rather than recessionary |
Sources: BLS June CPI, BLS June employment report and BEA May PCE.
Why hold rather than hike? Three reasons stand out.
- June inflation improved enough to justify waiting for confirmation. One month does not establish a trend, but hiking immediately after the largest monthly CPI decline since April 2020 would have been difficult to justify.
- Much of the renewed inflation risk came from oil, tariffs and other supply shocks. Higher rates can reduce demand, but they cannot produce more crude oil or reopen a disrupted shipping route. Tightening into a supply shock can slow growth without fixing the original shortage.
- Market borrowing costs had already risen. In his opening statement, Fed Chair Kevin Warsh highlighted materially higher nominal and real Treasury yields and nearly 20% four-quarter growth in AI-related equipment and software investment. His message was that financial conditions had tightened even without a change in the overnight policy rate.
This was therefore not a dovish all-clear. It was a decision to buy six weeks of data before the September 15 to 16 meeting.
Why Treasury Yields Rose After the Fed Kept Rates Unchanged
The Fed controls the interest rate for very short-term borrowing, mainly overnight loans between banks. However, home loans, long-term business investments and technology company valuations depend more on interest rates set by the bond market for the next 10 to 30 years.
Simply put, the Fed kept the overnight borrowing rate unchanged, but the market still made long-term loans more expensive.
| Treasury measure | July 28 | July 29 | One-day move |
| 2-year nominal yield | 4.26% | 4.22% | Down 4 bps |
| 10-year nominal yield | 4.61% | 4.67% | Up 6 bps |
| 10-year real yield | 2.41% | 2.41% | Unchanged |
| Approx. 10-year inflation compensation | 2.20% | 2.26% | Up 6 bps |
| 30-year nominal yield | 5.09% | 5.20% | Up 11 bps |
| 30-year real yield | 2.92% | 2.98% | Up 6 bps |
| Approx. 30-year inflation compensation | 2.17% | 2.22% | Up 5 bps |
The message is subtle:
- The fall in the 2-year yield says an immediate rate hike became less likely.
- The rise in the 10-year yield was driven mainly by higher inflation compensation.
- The 30-year move reflected both higher real rates and higher inflation compensation.
That is not the bond market saying, “The Fed tightened.” It is the market saying, “If the Fed waits, we want more compensation to lend for decades.” This is a credibility warning, but not yet a credibility crisis. Approximate 10-year and 30-year inflation compensation remained close to 2.2%, not at runaway levels. Direction is concerning; level is still contained.
The dollar told the same two-part story. It initially weakened because the Fed did not hike and short-rate expectations fell. The dollar index ended the US session down about 0.45% at 100.96, then recovered modestly in Asian trading as fresh geopolitical tension revived safe-haven demand. A Fed hold can weaken the dollar at first, but higher US yields and risk aversion can reverse that move quickly.
How Fed Rate Decision Could Affect Nvidia, Microsoft, Meta and Other AI Stocks
Partly, but not equally. The Nasdaq 100 was already 11% below its June high after the July 29 session. That suggests the market had begun discounting expensive valuations, heavy AI capex and the possibility of tighter financial conditions. However, “tech” is not one balance sheet or one cash-flow profile. The simplest way to separate the risk is the Three-Clock Test:
| Clock | What to track | Current message | Equity implication |
| Policy clock | Fed funds rate and 2-year yield | No July hike; immediate odds eased | Short-term relief |
| Duration clock | 10-year and 30-year real yields | Long-term discount rates remain high | Multiple pressure |
| Earnings clock | EPS revisions, AI revenue and free cash flow | Strong growth, but concentrated expectations | Company-specific outcomes |
The market is most vulnerable when the duration clock and earnings clock both turn negative. High yields alone do not guarantee falling stocks if profits rise fast enough. Weak earnings alone are manageable if discount rates fall. The harder combination is high yields plus disappointing AI returns.
Why are distant-profit companies more sensitive? A dollar earned many years from now must be discounted back to today. Imagine a company promises to earn $100 ten years from now. An investor asks: “How much money would I need to invest today to have $100 after ten years?” At an 8% annual return, $46.32 today can grow to $100. At 9%, only $42.24 is needed. Therefore, when interest rates rise, investors are willing to pay less today for the same future profit.
This is why higher rates hurt companies whose biggest profits are expected many years later. The longer investors must wait, the larger the reduction in the company’s current valuation.
This creates three distinct technology groups:
| Exposure group | Representative names | Main rate risk | What investors need to verify |
| Cash-generative platforms | Microsoft (MSFT), Alphabet (GOOGL), Amazon (AMZN), Meta (META) | Multiple pressure and lower free cash flow from capex | Whether AI revenue grows faster than infrastructure spending |
| AI chips and infrastructure | Nvidia (NVDA), Broadcom (AVGO), AMD (AMD), Vertiv (VRT) | High expectations and customer capex-cycle risk | Orders, backlog, margins and hyperscaler spending |
| Externally financed growth tech | Smaller or unprofitable software firms | Funding cost plus distant cash flows | Cash runway, dilution risk and path to positive free cash flow |
The earnings buffer is meaningful. FactSet’s July 24 report showed second-quarter Information Technology (IT) earnings growth of 64.6%, led by 134% growth in semiconductors. Excluding semiconductors, technology growth fell to 26.1%.
For the S&P 500, the headline growth rate was 37.9%, but 25.9% excluding Alphabet, whose reported earnings included a large valuation gain. The data shows that profits are still growing strongly, but the most spectacular numbers are concentrated.
That argues against treating the Fed hold as a reason for an indiscriminate technology selloff. It does support tougher scrutiny. Meta’s updated 2026 capex range of $130 billion to $145 billion and Microsoft’s better-than-expected cloud growth, both reported after their latest results, illustrate the new dividing line: spending alone is not enough; investors want visible revenue and cash returns.
FOMC Rate Outlook: Will the Fed Raise Interest Rates in 2026?
There is no stable analyst consensus. That matters because markets generally handle bad news better than unresolved news.
| Firm or economist | Post-meeting rate view | Core rationale or implication |
| JPMorgan | One 25-bps hike in December; September remains possible | Warsh’s communication created a credibility risk that could push the committee to act |
| BofA Global Research | Three hikes beginning in September | The Fed may need to restore inflation-fighting credibility |
| Goldman Sachs and Barclays | No change through year-end | Both remain in the hold camp; Reuters did not publish their detailed rationale |
| Citigroup | Cuts in October and December 2026, then January 2027 | A clear dovish outlier relative to the post-meeting market |
| Wells Fargo, Tom Porcelli | Hold through year-end unless inflation rises | Patience is appropriate when inflation is driven by supply shocks |
Sources: Reuters, BoFA, Bloomberg
CME FedWatch pricing was equally unstable. Reuters recorded roughly 57% odds of a September hike late Wednesday and 65.2% early Thursday, down from 81% before the policy statement in the later comparison. The exact probability will keep moving. The useful point is that September is live, not that one intraday percentage is a forecast.
S&P 500 Outlook After the Fed Rate Decision: Valuation Scenarios
After the July 29 decline, S&P 500 is trading at about 20 times expected earnings, slightly above the 10-year average of 19 times. A 20 times multiple equals a 5% forward earnings yield, only 0.33 percentage point above the 4.67% 10-year Treasury yield.
That 0.33-point gap is an original valuation pressure gauge, not an equity risk premium. It does not account for future earnings growth, dividends, buybacks or the different risk of stocks and government bonds. It simply shows that equities have a thin current-earnings cushion over a high risk-free yield.
Using the July 29 S&P 500 close of 7,316.15 and an approximate 20 times multiple gives implied forward earnings of about 365.8 index points. Holding those earnings constant produces this sensitivity:
| Assumed forward P/E | Implied S&P 500 level | Change from July 29 close |
| 18 times | 6,585 | Down 10.0% |
| 19 times | 6,950 | Down 5.0% |
| 20 times | 7,316 | Flat |
| 21 times | 7,682 | Up 5.0% |
This is not a target-price model. It shows the arithmetic of multiple compression. A move from 20 times to the 10-year average of 19 times produces a 5% decline if earnings do not change. The same market can avoid that decline if forward earnings rise by roughly the same amount.
The US Stock Market path therefore depends on three scenarios:
| Scenario | What would confirm it | Likely market read-through |
| Disinflation plus earnings delivery | Core inflation cools, oil retreats, long yields stabilise and AI free cash flow improves | Broad indices stabilise; quality growth gets breathing room |
| Sticky inflation plus positive earnings | Fed stays cautious, yields remain high and EPS revisions hold | Range-bound index with sharp stock and sector dispersion |
| Inflation relapse plus earnings cuts | Oil rises materially, core inflation reaccelerates, 10-year yield approaches 5% and AI estimates fall | Multiple compression broadens beyond speculative tech |
The unchanged Fed rate does not decide which row wins. Inflation, oil, long yields and earnings do.
What US Stock Investors Should Watch After July Fed Meeting
The July Fed hold was mostly priced. The long-bond reaction and the Fed’s communication problem were not. That makes another broad correction possible, but not automatic. For investors, five checks are more useful than trying to predict the next FOMC vote:
- Track the 10-year real yield, not only the Fed rate. The real yield is a cleaner measure of the discount-rate pressure facing growth stocks.
- Separate AI spending from AI returns. Compare capex growth with cloud revenue, AI revenue, operating cash flow and free cash flow.
- Group technology holdings by funding dependence. A profitable platform funding capex internally is not exposed in the same way as an unprofitable company that may need fresh capital.
- Include currency in the return calculation. INR return is approximately the US stock return plus the change in USD/INR, with a small interaction effect. A weaker dollar can reduce INR returns even when a US stock rises.
- Watch the data sequence. June PCE and second-quarter GDP were due on July 30, followed by July jobs on August 7, July CPI on August 12, the July FOMC minutes on August 19 and the next Fed meeting on September 15 to 16. Official dates are available from the BEA, BLS and Federal Reserve.
The rupee was near 95.62 per dollar on July 30 morning, little changed after the decision. Brent crude was around $89.75 and up 48% in 2026. For Indian investors especially, oil matters twice: it can keep US inflation high and it can pressure the rupee, complicating the currency effect on US holdings.
- US Market Bull case: June’s inflation improvement continues, oil stabilises, long-term yields stop rising and strong earnings convert AI capex into visible cash flow. In that setup, the recent correction may have already absorbed much of the rate risk.
- US Market Bear case: Oil and core inflation rise again, the Fed is forced into a late tightening cycle, the 10-year Treasury moves toward or above 5%, and AI earnings estimates weaken. That combination can turn a sector correction into broader multiple compression.
The question is no longer whether the Fed kept rates unchanged. It is whether AI earnings can grow fast enough to outrun a higher cost of capital, while the Fed keeps long-term inflation expectations anchored without resorting to aggressive late hikes. That is the debate investors should track, not one meeting-day headline.