

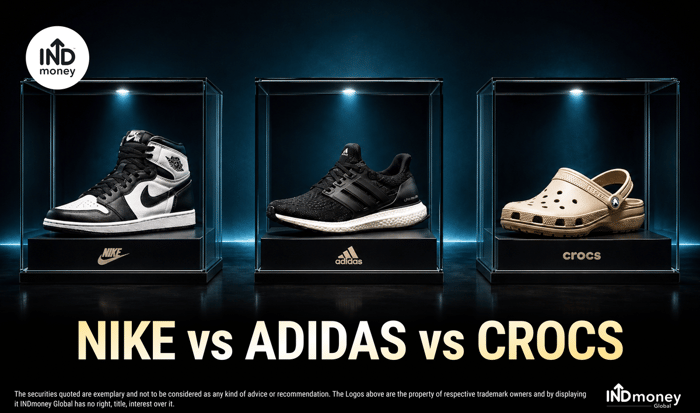
- Nike vs Adidas vs Crocs: Quick Verdict
- These Companies Share A Shoe Rack, Not A Business Model
- Nike: The Strongest Castle, Currently Under Renovation
- Adidas: The Strongest Operating Momentum
- Crocs: A Cash Machine Wearing A Foam Clog
- Nike vs Adidas vs Crocs: Which Brand Leads Each Segment?
- The Sole, Shelf, Spread & Stock Framework
- Which Company Is Winning Geographically?
- NKE vs ADDYY vs CROX Stock Performance
- Nike vs Adidas vs Crocs Valuation Comparison
- What Does Each Share Price Ask Investors To Believe?
- Which Stock Makes The Most Sense For Global Sportswear Exposure?
- What Could Change This Conclusion?
- Nike, Adidas and Crocs Competitors Investors Should Not Ignore
- Final Verdict: Three Winners, But In Three Different Games
Three footwear stocks, three very different bets. Nike owns the deepest global brand moat, but its income statement is undergoing major surgery. Adidas has the strongest business momentum, although its valuation already recognises part of that recovery. Crocs has the best margins and cheapest valuation, but it is also the narrowest and most trend-sensitive business.
In short, Adidas is winning the operating race, Crocs is winning the valuation race, and Nike remains the turnaround with the biggest gap between potential and present performance.
Let’s break down how Nike, Adidas and Crocs make money, where each one dominates, what their latest results reveal, and what their current share prices already expect. By the end, choosing between them should feel less like judging three shoes and more like deciding which kind of investment risk belongs in your portfolio.
Nike vs Adidas vs Crocs: Quick Verdict
| Question | Current winner | Why |
| Deepest overall brand moat | Nike | Unmatched scale, athlete ecosystem and cultural relevance |
| Strongest current business momentum | Adidas | Double-digit growth across performance, DTC and major markets |
| Best margins and cash economics | Crocs | Around 24% adjusted operating margin and strong free cash flow |
| Broadest sportswear exposure | Nike | Running, basketball, football, lifestyle and apparel at scale |
| Cleanest broad sportswear story today | Adidas | Growth is broadening beyond Samba-led lifestyle products |
| Cheapest current valuation | Crocs | About 9 times 2026 adjusted EPS |
| Largest turnaround potential | Nike | Earnings remain far below what its brand could eventually support |
| Narrowest business model | Crocs | The Classic Clog ecosystem still carries the company |
| Highest execution burden | Nike | Wholesale, China, lifestyle and margins all need repair |
For investors seeking broad global sportswear exposure, Adidas currently offers the cleanest combination of growth, product momentum and improving profitability. But its valuation is reasonable rather than irresistible.
Crocs offers the most attractive cash flow relative to price. However, it should be viewed as a specialist comfort-footwear business, not as a cheaper substitute for Nike or Adidas.
Nike has the greatest brand ceiling, but also the hardest earnings recovery. Paying for Nike merely because it is Nike would confuse a powerful brand with a currently powerful business.
These Companies Share A Shoe Rack, Not A Business Model
Nike and Adidas are direct competitors across running, football, basketball, lifestyle footwear and apparel. Crocs competes with them for footwear spending, but it plays a much narrower game.
| Metric | Nike | Adidas | Crocs |
| Ticker | NKE | ADDYY | CROX |
| Latest price | $40.06 | $89.10 | $128.66 |
| Market capitalisation | $59.4 billion | $31.8 billion | $6.4 billion |
| Latest annual or guided revenue | $46.4 billion | About €27 billion | About $4.1 billion |
| Core business | Global sportswear | Global sportswear | Casual comfort footwear |
| Main brands | Nike, Jordan, Converse | Adidas | Crocs, HEYDUDE |
| Latest growth indicator | FY2026 revenue down 2% currency-neutral | H1 2026 revenue up 14% currency-neutral | H1 2026 revenue up 0.7% |
| Latest operating margin | 6.1% underlying FY2026 | 9.6% in H1 2026 | 23.9% adjusted in H1 2026 |
| Business shape | Broadest and largest | Broad and globally balanced | Concentrated but highly profitable |
Nike’s FY2026 figures come from its full-year results. Adidas figures use its H1 2026 report and full-year guidance. Crocs figures come from its Q2 2026 results.
That operating-margin comparison needs context. Crocs sells relatively simple, high-margin moulded footwear. Nike and Adidas support much larger apparel portfolios, athlete contracts, federations, research operations and global wholesale networks.
Even after adjusting for that difference, Crocs’ economics are exceptional. The question is whether those economics are durable enough to compensate for its narrower moat.
Nike: The Strongest Castle, Currently Under Renovation
Nike generated $46.4 billion of FY2026 revenue, making it larger than Adidas and Crocs combined. Its North American business alone produced $20.5 billion.
The scale is unquestionable. The quality of current earnings is not.
Nike reported FY2026 EPS of $2.10. However, its fourth quarter included a $986 million tariff recovery. Excluding that benefit, management calculated underlying full-year EPS of $1.58 and an underlying gross margin of 40.8%.
That distinction is important. At $40.06, Nike trades at approximately:
- 19 times reported FY2026 EPS
- 25 times underlying FY2026 EPS
The second number offers the more honest picture of what investors are paying for the operating business.
Nike’s problem is not that people have forgotten the Swoosh. Its problem is that the company weakened the machinery used to convert that recognition into profitable sales.
During its earlier direct-to-consumer push, Nike reduced supply to several wholesale partners and relied heavily on its own digital channels. That looked attractive when online demand was booming. But specialty retailers are not merely checkout counters. They help consumers discover shoes, compare brands and obtain expert recommendations.
By withdrawing from parts of that shelf space, Nike gave competitors such as Hoka, On, New Balance and Adidas more room to build relationships with runners.
Management is now reversing that damage. Wholesale revenue increased 4% on a currency-neutral basis in FY2026, approximately 15,000 wholesale spaces were refreshed, and Nike Running recorded five consecutive quarters of double-digit growth. Management said the running business added roughly $1 billion of revenue during the year.
The bad news is that Nike Sportswear and Jordan Streetwear, which together represent roughly half the business, remain under pressure. Management expects both to decline during FY2027 before potentially improving in the second half. Greater China revenue also fell 13% currency-neutral in FY2026.
Our view is straightforward: Nike has begun repairing running and wholesale, but it has not yet repaired its entire earnings engine.
What makes Nike’s moat special?
Nike’s moat has four layers:
- The Swoosh and Jordan create instant recognition across sport and culture.
- Decades of athlete, team and federation relationships create credibility.
- Product platforms such as Air, ZoomX and Flyknit support genuine innovation.
- Its global scale allows enormous marketing, distribution and research spending.
Nike’s moat is therefore broad. It can move from elite running to basketball, children’s footwear, football kits and streetwear without introducing a new corporate identity.
But a moat is not the same as immunity. Nike’s recent performance proves that even the strongest brand can lose momentum when distribution, product freshness and local execution deteriorate simultaneously.
Adidas: The Strongest Operating Momentum
Adidas is currently doing what Nike is trying to do: growing performance products, lifestyle franchises, wholesale and direct sales at the same time.
In H1 2026:
| Adidas H1 2026 metric | Result |
| Currency-neutral revenue growth | 14% |
| Direct-to-consumer growth | 23% |
| E-commerce growth | 26% |
| Wholesale growth | 7% |
| Performance-category growth | 34% |
| Lifestyle growth | 4% |
| Apparel growth | 33% |
| Footwear growth | 2% |
| Operating margin | 9.6% |
Adidas’ Q2 results show that this is no longer only a Samba, Gazelle or Terrace-fashion recovery. Q2 performance revenue grew 39%, supported by running, training and football.
That matters because lifestyle shoes can move through trend cycles rapidly. Performance products are usually harder to build because athletes care about fit, weight, cushioning, durability and measurable results. Growth across both sides gives Adidas a healthier engine.
Management raised its FY2026 currency-neutral revenue-growth guidance to 9%-10%, while maintaining an operating-profit target of approximately €2.3 billion.
Yet this is not a flawless recovery.
H1 inventory increased 13%, while operating working capital rose 18%. Marketing expenditure reached €1.68 billion, up 15%, partly because Adidas was investing around the 2026 FIFA World Cup. Higher marketing can strengthen long-term demand, but inventory and cash conversion must eventually confirm that growth is profitable rather than promotional.
This is why we view Adidas as the strongest operating story of the three, but not a finished margin story.
The Adidas moat
Adidas combines two identities unusually well:
- Performance credibility in football, running and training
- Fashion relevance through Originals, archive designs and collaborations
Its three-stripe identity and football heritage are difficult to replicate. Just as importantly, Adidas has been giving regional teams greater freedom to create products for local consumers. The company operates creation centres across cities including Los Angeles, Portland, Shanghai, Tokyo and locations in India and Latin America, supporting what it calls a global brand with a local mindset.
Nike’s brand may be stronger in absolute terms. Adidas’ current organisation is extracting more momentum from its brand.
Crocs: A Cash Machine Wearing A Foam Clog
Crocs does not need to beat Nike in basketball or Adidas in football. It needs consumers to keep buying comfortable clogs, sandals and Jibbitz accessories.
That simpler task has produced outstanding economics.
Crocs reported record Q2 2026 revenue of $1.18 billion. The Crocs brand crossed $1 billion in quarterly revenue for the first time, while direct-to-consumer sales increased 12%.
| Crocs H1 2026 metric | Result |
| Revenue growth | 0.7% |
| Adjusted gross margin | 58.6% |
| Adjusted operating margin | 23.9% |
| Free cash flow | $232 million |
| Outstanding shares since Dec. 2025 | Down roughly 4% |
Growth is modest, but Crocs converts an unusually large portion of each sales dollar into cash. Its product is inexpensive to manufacture, inventory complexity is lower than at a broad sportswear company, and capital expenditure requirements are limited.
The Crocs brand itself remains healthy. In Q2, international revenue increased 7.8% and exceeded North American revenue. North America grew only 0.4%, suggesting that the company’s next chapter increasingly depends on markets outside its original US base.
The main weakness is HEYDUDE. The acquired brand’s Q2 revenue declined 5.7%, including a 17.2% wholesale decline. Crocs recorded approximately $737 million of HEYDUDE-related impairments in 2025, which tells investors how badly the original acquisition assumptions missed reality.
Crocs is therefore two stories:
- A highly profitable core Crocs franchise
- An acquired HEYDUDE business still searching for stable demand
The Crocs moat
The Crocs moat is narrower than Nike’s, but deep within its category.
The Classic Clog silhouette is instantly recognisable. Croslite material supports comfort and consistent manufacturing. Jibbitz turn a standard shoe into a personalised product. Collaborations generate attention without requiring Crocs to redesign its entire platform.
Jibbitz are especially clever. A normal shoe is bought once. A personalised Crocs ecosystem creates reasons to return, collect and express identity. It resembles adding apps to a smartphone: the core product stays familiar, while small additions make it feel personal.
The danger is concentration. Nike can survive a weak basketball launch because it also has running, football and apparel. If the clog cycle weakens meaningfully, Crocs has fewer engines available.
Nike vs Adidas vs Crocs: Which Brand Leads Each Segment?
| Segment | Current leader | What is happening |
| Basketball and athlete culture | Nike | Jordan and Nike retain the strongest combined ecosystem |
| Global football | Adidas | Deep football heritage, federation presence and product momentum |
| Running | No clear monopoly | Adidas and Nike are improving, but On, Hoka, Asics and New Balance are formidable |
| Lifestyle footwear momentum | Adidas | Originals and low-profile products have stronger current sell-through |
| Casual comfort | Crocs | Category ownership and personalisation provide a clear edge |
| Apparel scale | Nike | Largest platform, although Adidas currently has faster growth |
| Wholesale momentum | Adidas | Wholesale growth is positive while Nike is still rebuilding relationships |
| Direct-to-consumer momentum | Adidas | H1 DTC increased 23%; Crocs DTC is also performing well |
| Product-level profitability | Crocs | Simpler products and premium pricing generate superior margins |
| Brand breadth | Nike | Its relevance extends furthest across sports, products and demographics |
The running market deserves special attention. Nike once appeared almost unassailable, but running became more fragmented as consumers embraced technically focused brands such as Hoka and On.
Nike’s latest running growth shows that the company is fighting back. Adidas is also benefiting from Adizero and other performance lines. However, neither should be valued as if running has returned to being a two-brand contest.
That is one reason this industry is becoming more interesting and more difficult. Consumers increasingly choose different brands for different uses: Hoka for a long run, Adidas for football, Nike or Jordan for basketball, and Crocs for everyday comfort.
The Sole, Shelf, Spread & Stock Framework
To compare such different businesses, we use four questions.
| Test | Nike | Adidas | Crocs |
| Sole: Is product demand improving? | Running yes; lifestyle still weak | Strong across performance and lifestyle | Core brand healthy; HEYDUDE weak |
| Shelf: Is distribution helping? | Wholesale recovery in progress | Wholesale and DTC both growing | DTC and international strong; wholesale softer |
| Spread: Does growth become cash? | Underlying margin and FCF remain weak | Margin improving; working capital needs watching | Best margins and cash conversion |
| Stock: What does valuation expect? | Demands a strong recovery | Prices in moderate execution | Embeds low growth and meaningful risk |
This framework separates the shoes consumers love from the stock investors have to price.
Nike wins the long-term brand test. Adidas wins the present product-and-distribution test. Crocs wins the spread between revenue and cash.
Which Company Is Winning Geographically?
Reported regions and currencies differ, so the following table is best used to compare direction and momentum rather than calculate exact market share.
| Geography | Nike | Adidas | Crocs | Current read |
| North America | FY2026 revenue $20.5 billion, up 5% | H1 revenue €2.72 billion, up 15% currency-neutral | Core-brand Q2 revenue up 0.4% | Nike leads in scale; Adidas leads in momentum |
| Europe | EMEA revenue $12.6 billion, down 3% currency-neutral | H1 Europe revenue €4.20 billion, up 6% | Included within international reporting | Adidas currently has healthier momentum |
| Greater China | FY2026 revenue $5.85 billion, down 13% currency-neutral | H1 revenue €2.09 billion, up 16% | China has become a major growth market | Adidas and Crocs have momentum; Nike is resetting |
| Latin America | Included in APLA, which was down 1% currency-neutral | H1 revenue up 27% currency-neutral | Included within international | Adidas is the clearest growth winner |
| Japan and South Korea | Included in APLA | H1 revenue up 21% currency-neutral | Included within international | Adidas has strong disclosed momentum |
| International overall | Huge scale but mixed performance | Broad growth across markets | Q2 international core-brand revenue up 7.8% | Adidas has the broadest current momentum |
China may be the most important battleground. Nike remains a large brand there, but Western labels are no longer competing only against each other. Anta, Li-Ning and Xtep have improved their products, marketing and cultural relevance.
Nike must repair local execution. Adidas’ 16% H1 currency-neutral growth and 27.7% segment operating margin in Greater China show that a Western brand can still grow profitably there. Crocs is using local designs, Jibbitz and collaborations to turn its unusual silhouette into a strength.
Our conclusion is that Nike still dominates overall global scale, while Adidas is currently gaining more efficiently across geographies. Crocs dominates a much smaller category and is using international expansion to extend it.
NKE vs ADDYY vs CROX Stock Performance
| Stock (Ticker) | Price | 2026 YTD return | One-year return | Five-year return |
| Nike (NKE) | $40.06 | -36.69% | -47.89% | -76.12% |
| Adidas (ADDYY) | $89.10 | -9.26% | -9.36% | -49.71% |
| Crocs (CROX) | $128.66 | +47.7% | +54.36% | -9.35% |
(as of August 19th, 2026 as per Google Finance)
- Nike’s collapse reflects a large earnings reset, weak lifestyle demand, China pressure and diminished investor confidence. The decline does not automatically make it cheap. A lower share price accompanied by lower sustainable earnings can leave valuation unchanged or even higher.
- Adidas has performed better than Nike, but its five-year return still reflects the difficult period surrounding Yeezy, excess inventory and the subsequent business reset.
- Crocs has delivered the strongest recent share-price performance. Earnings resilience, large repurchases and a previously depressed valuation helped the stock rerate. Yet even after the rally, its multiple remains the lowest of the three.
Nike vs Adidas vs Crocs Valuation Comparison
| Valuation measure | Nike | Adidas ADDYY | Crocs |
| Price-to-sales | 1.3 times | ~ 1.0 times 2026E | ~ 1.6 times 2026E |
| Earnings multiple | 25 times underlying FY2026 EPS | ~ 17 times modelled 2026 EPS | 9.3 times guided 2026 adjusted EPS |
| Estimated trailing FCF yield | 3.7% | ~ 6%-7% | ~ 11% |
| Balance-sheet position | ~ $1.1 billion net cash, excluding leases | 1.6 times adjusted net borrowings/EBITDA | ~ $1.14 billion net debt |
| Latest comparable operating margin | 6.1% underlying | 9.6% | 23.9% adjusted |
Free cash flow is the cash remaining after operating expenses and capital expenditure. Free-cash-flow yield divides that cash by market capitalisation.
Think of it like rental yield on a property. A high yield may indicate an attractive price, but it can also warn that the market expects the rent to fall.
Nike’s Valuation
Nike does not look expensive on reported EPS. It looks less comfortable on underlying earnings and cash flow.
FY2026 free cash flow was approximately $2.18 billion, giving a yield of only 3.7%. Dividends of roughly $2.4 billion exceeded free cash flow for the year. Nike has a solid balance sheet, so this is not an immediate financial threat. But the business must restore cash generation if dividend growth is to remain healthy.
Nike’s valuation is therefore a bet on normalisation, not a payment for currently normal earnings.
Adidas’ Valuation
Using management’s €2.3 billion operating-profit guidance, a reasonable tax and interest estimate produces roughly €9 of 2026 earnings per ordinary share. That places ADDYY at approximately 17 times forward earnings.
Our trailing free-cash-flow estimate is based on the company’s 2025 annual results and H1 2026 cash-flow statements. Seasonality can make this figure volatile.
Adidas looks fairly valued for a company growing at its current rate. The opportunity becomes stronger if operating margin keeps rising and working-capital growth slows. If growth cools before margins improve, the present valuation leaves less protection.
Crocs’ Valuation
At the midpoint of management’s $13.70-$14.00 adjusted EPS guidance, Crocs trades at approximately 9.3 times 2026 earnings.
Estimated trailing free cash flow is around $705 million, equivalent to roughly 11% of market capitalisation. The company has also increased its repurchase authorisation to $2 billion.
This is the most attractive headline valuation. It is also the valuation with the clearest explanation: the market doubts the durability of clog demand, remains sceptical about HEYDUDE and worries that repurchases could delay debt reduction.
Crocs is cheap, but not accidentally cheap.
What Does Each Share Price Ask Investors To Believe?
Traditional valuation starts with a forecast and produces a target price. We prefer to reverse the calculation.
Assume an investor wants a 10% annual share-price return over three years, excluding dividends. We then ask how much 2029 EPS each company would need under a reasonable terminal P/E multiple.
Required 2029 EPS = (Current price × 1.10^3) / Terminal P/E
| Company | Starting earnings | Assumed 2029 P/E | Required 2029 EPS | Required annual EPS growth |
| Nike | $1.58 underlying | 20 times | $2.67 | 19.1% |
| Adidas | About $5.17 per ADR | 17 times | $6.98 | 10.5% |
| Crocs | $13.85 guidance midpoint | 10 times | $17.12 | 7.3% |
For Adidas, the ADR earnings estimate assumes approximately €9 of ordinary-share EPS, two ADRs per ordinary share and EUR/USD of 1.15.
This is an expectations test, not a target-price model. Terminal multiples and currencies can change. Buybacks can also increase EPS without equivalent revenue growth.
Still, the message is useful:
- Nike must produce the steepest earnings recovery.
- Adidas needs solid but achievable growth.
- Crocs needs the least earnings growth, although its earnings are less diversified.
A hurdle can be low because the race is easy, or because the track is dangerous. Crocs has the lowest hurdle and the narrowest track. Nike has the widest track and the tallest hurdle.
Which Stock Makes The Most Sense For Global Sportswear Exposure?
For broad global sportswear exposure: Adidas
Adidas currently offers the cleanest combination of performance growth, lifestyle relevance, wholesale health and geographic momentum.
It is not deeply undervalued. Investors are paying a fair multiple for a recovery that is already visible. The next phase must come from higher margins and better cash conversion, not simply faster sales.
Our view: Adidas is the strongest operating business of the three today and the most direct answer for investors seeking broad international sportswear exposure. Its current price calls for selectivity rather than excitement.
For brand-led turnaround exposure: Nike
Nike remains the company with the deepest overall moat and greatest earnings potential if distribution, China and lifestyle products recover together.
But the market is not offering that optionality for free. On underlying earnings, Nike still trades at a meaningful premium to Crocs and above Adidas.
Our view: Nike should be treated as a turnaround security, not as a defensive blue-chip consumer stock. Evidence of margin recovery matters more than stories about past dominance.
For cash flow and valuation exposure: Crocs
Crocs provides the best margins, free-cash-flow yield and current earnings multiple.
However, it is not broad sportswear exposure. It is a concentrated wager on casual comfort, personalisation, international growth and management’s ability to prevent HEYDUDE from consuming more capital.
Our view: Crocs has the most attractive price-to-cash-flow relationship, but it belongs in a different mental bucket from Nike and Adidas. Its valuation compensates investors for concentration risk rather than eliminating it.
What Could Change This Conclusion?
| Company | Evidence that would strengthen the case | Warning that would weaken it |
| Nike | Underlying gross margin rises; Sportswear stabilises; China improves | Revenue declines continue while promotions remain high |
| Adidas | Operating margin approaches double digits sustainably; inventory grows slower than sales | Working capital and marketing absorb most profit growth |
| Crocs | International growth stays strong; HEYDUDE stabilises; debt falls | Core Crocs demand weakens or buybacks materially increase leverage |
These are more useful than watching daily share prices.
- For Nike, monitor underlying gross margin rather than reported figures influenced by recoveries or one-offs.
- For Adidas, compare inventory and working-capital growth with revenue growth.
- For Crocs, track the core Crocs brand separately from HEYDUDE, along with net debt and share count.
Nike, Adidas and Crocs Competitors Investors Should Not Ignore
The global sportswear industry is no longer a clean Nike-Adidas duopoly.
| Competitor group | Where it threatens |
| On, Hoka, Asics and Brooks | Technical and speciality running |
| New Balance and Puma | Lifestyle, football, running and general sportswear |
| Anta, Li-Ning and Xtep | China and other Asian markets |
| Skechers and Birkenstock | Comfort and casual footwear |
| UGG, Teva and other Deckers brands | Casual, outdoor and lifestyle spending |
| Lululemon and Alo Yoga | Premium athletic apparel |
| Salomon and other technical brands | Trail, outdoor and fashion crossover |
GlobalData estimates cited by The Guardian put Nike at roughly 14% and Adidas at about 9% of the global sportswear market, while On was around 1%. That may make On appear small, but category-level share matters more than total-company share. In selected running markets, specialist brands have become much more influential.
Nike and Adidas still have enormous advantages in scale. What has disappeared is their ability to assume that every emerging sportswear consumer will naturally choose one of them.
Final Verdict: Three Winners, But In Three Different Games
Nike is still the most powerful global sportswear brand. Adidas is currently running the healthiest global sportswear business. Crocs is producing the strongest economics relative to its valuation.
That distinction is the entire investment case.
If the objective is broad global sportswear exposure, Adidas makes the most sense on current operating evidence. The valuation is sensible, not obviously cheap, so margin execution and cash conversion remain essential.
If the objective is maximum cash yield at a lower earnings multiple, Crocs is the more compelling setup. But the investor must accept that a concentrated comfort-footwear franchise can never be analysed like a diversified sportswear platform.
Nike offers the largest turnaround optionality. It also requires approximately 19% annual underlying EPS growth in our expectations test, far more than Adidas or Crocs. Nike can eventually win again, but the financial results must catch up with the logo.
The simplest way to remember the comparison is this:
- Nike owns the strongest castle, but it is under renovation.
- Adidas currently has the busiest marketplace.
- Crocs operates the smallest shop, but keeps the most cash from each sale.
There is no universal winner. There is only the business whose growth burden, moat and risk best match what the investor is actually trying to own.