
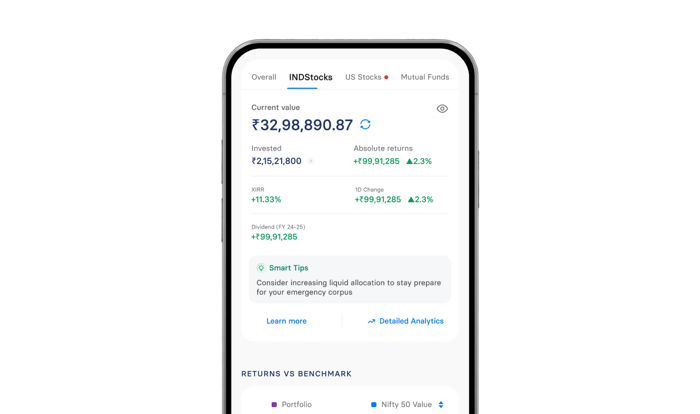
- XIRR: Know How Your Money Is Really Growing
- The Benchmark Test: Are You Beating the Market or Just Keeping Pace?
- Sectoral Allocation: Understand Your Portfolio Beyond Individual Stocks
- How Balanced Is Your Portfolio Across Market Caps?
- Auto-Monitor Your INDstocks Portfolio: All On One Screen
Do you typically review your P&L, examine a few green or red candles, and then proceed?
You're keeping up with your portfolio, which is great. But daily price changes don't always show the full picture, like where risks might be building or what's really helping your returns grow.
Most of the time, we’re just watching numbers change instead of gaining real insights into our portfolios.
INDmoney wanted to change that. With Advanced Analytics on your Indian Stock portfolio, your investment data is now clear with visual insights helping you spot risks you didn’t know you had, and opportunities that may have gone unnoticed.
Let’s walk you through how.
XIRR: Know How Your Money Is Really Growing
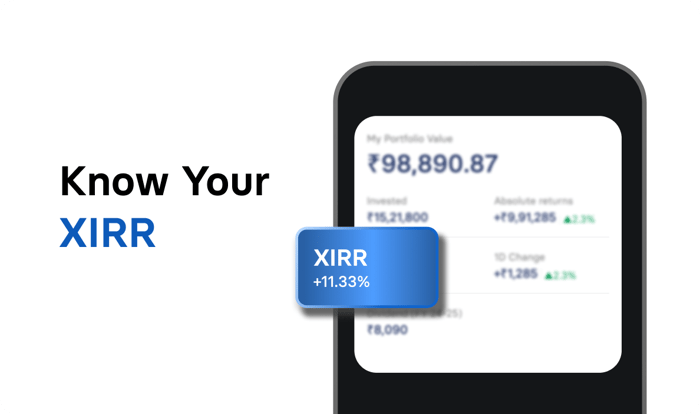
Understanding your true profit is often the hardest part of investing.
The analytics dashboard solves this with XIRR, which looks beyond absolute returns to show how much your money is actually growing each year. It answers the one question that really matters: Is your money working hard enough for you?
This helps you:
- See your real growth by tracking exactly when you invested
- Analyse whether new deposits are actually building your wealth
- Check if your strategy is truly beating the market average
Beyond just numbers, INDstocks analytics dashboard brings your entire financial picture into one simple view, tracking total invested value, current investment value, and dividends without switching between different apps or messy spreadsheets.
The Benchmark Test: Are You Beating the Market or Just Keeping Pace?
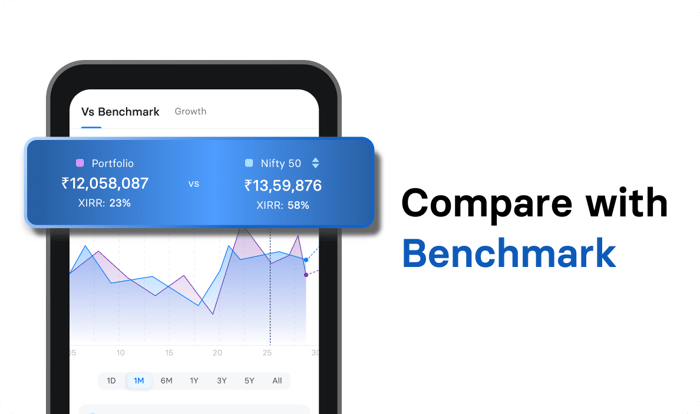
Profit alone doesn’t tell the full story.
Without a point of comparison, it’s impossible to know whether your stock picks are truly performing or if you’re simply riding along with the market’s natural ups and downs.
INDmoney’s analytics dashboard acts as a reality check. It places your portfolio next to the Nifty 50, showing your returns side by side with the broader market.
This comparison adds powerful context. That clearly shows whether your investing decisions are adding real value or whether a passive index strategy might have delivered similar results.
It shifts your idea from “Did I make money?” to “Did I invest well?”
Sectoral Allocation: Understand Your Portfolio Beyond Individual Stocks
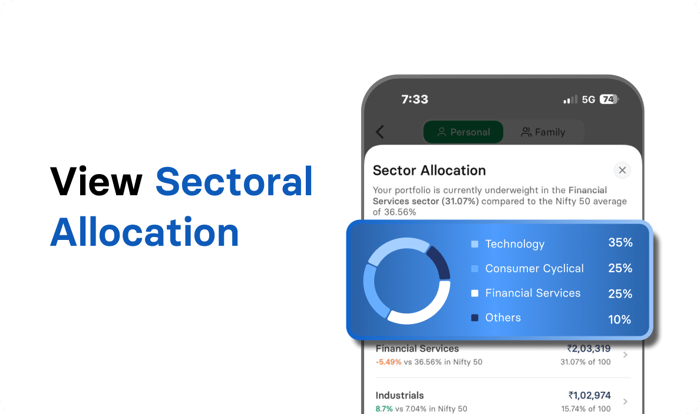
Real diversification isn’t about owning a long list of companies. It’s about making sure your portfolio isn’t vulnerable to a setback in a single industry.
INDstocks Analytics dashboard helps you visualise this clearly by grouping your holdings across industries like technology, financials, pharma, and more.
Instead of guessing, you instantly see where your money is actually concentrated. This makes it easier to:
- Spot if you’re accidentally betting too heavily on one sector.
- Lock in gains by reallocating capital to overlooked or undervalued industries.
- Detect hidden risks early before a sector dip impacts your entire portfolio.
How Balanced Is Your Portfolio Across Market Caps?
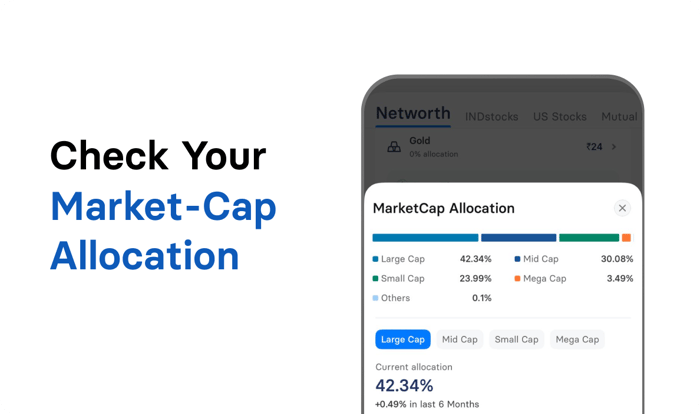
Not all stocks react to markets in the same way. Large-cap companies are usually more stable, mid-caps often balance growth and risk, while small caps can move faster but come with higher volatility.
That’s why it’s important to see whether your portfolio matches the kind of growth and risk you’re aiming for.
The Market Cap view maps your exposure across Large, Mid, and Small-cap stocks, helping you understand your risk profile at a glance.
Think of it as a way to:
- Balance high-growth small caps with the stability of market leaders
- Audit your risk before market swings catch you off guard
- Confirm your holdings align with your long-term financial goals
Auto-Monitor Your INDstocks Portfolio: All On One Screen
Most platforms help you transact; INDmoney helps you reflect.
By bringing together performance metrics, benchmarks, sector exposure, market cap distribution, and personalised insights, INDstocks turns investing into something more intentional.
- You stop reacting to daily price movements.
- You start understanding patterns.
- You make decisions with context, not emotion.
Whether it’s a beginner building their first portfolio, an investor reviewing long-term performance, or a trader looking to sharpen their strategy, INDstocks simplifies the hardest part of investing, which is analysis.
Disclaimer:
Investments in the securities market are subject to market risks, read all the related documents carefully before investing. This is nowhere to be considered as an advice, recommendation or solicitation of offer to buy or sell or subscribe for securities. INDstocks Private Limited (formerly known as INDmoney Private Limited) 616, Level 6, Suncity Success Tower, Sector 65, Gurugram, 122005, SEBI Stock Broking Registration No: INZ000305337, Trading and Clearing Member of NSE (90267, M70042) and BSE, BSE StarMF (6779), AMFI Registration No: ARN-254564, SEBI Depository Participant Reg. No. IN-DP-690-2022, Depository Participant ID: CDSL 12095500, Research Analyst Registration No. INH000018948 BSE RA Enlistment No. 6428.